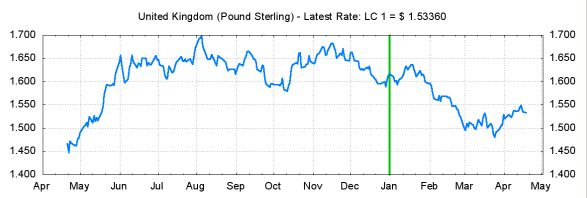
Gnuplot is a great command line tool that creates very quickly graphs from data files.
The official site of Gnuplot is: http://www.gnuplot.info/ . To see examples of graphs produced by Gnuplot, you should have a look here: http://gnuplot.sourceforge.net/demo_4.4/.
Using python and gnuplot, I produced approx 80 graphs similar to the one below, that fitted nicely on 5 A4 pages. 
Python scans a very long file with all the historical data and passes the required data for each graph to gnuplot. The result is 80 graphs as png files in less than a minute. Then another script in processing puts everything together in a 5 page pdf file (2 cols x 8 rows = 16 per page). AutoHotKey is what “glues” everything together and makes this a “single click” solution.